|
|
|
 |
..... |
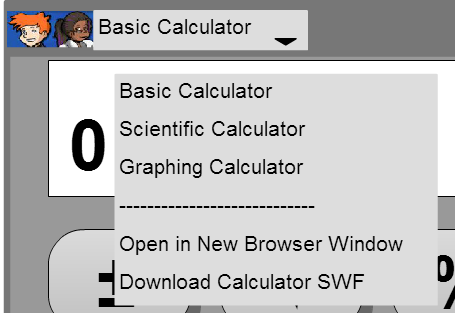
The Calculator was developed for mathclips.ca. Click the icon at the top left to visit that resource. There are actually three separate calculators. Click the picker at the top left to choose between them. You can run the calculator in a new browser window. One of the nicest features of the calculator is that you can download it as a SWF file for offline use. |
 |
InformationEach calculator has an i button for additional information including keyboard shortcuts and credits. |
|
 |
Background ColourClick on a colour swatch at the bottom of the calculator to change the background colour. |
 |
...... |
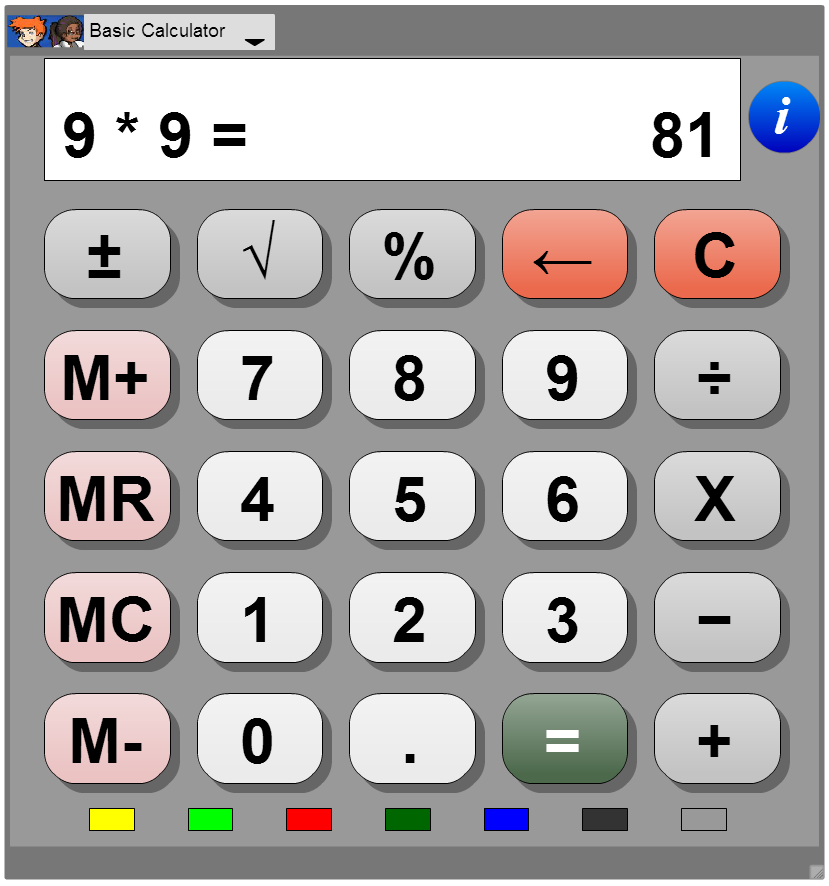
The Basic calculator operates like most simple calculators. Press the = key to calculate the answer. This also places the answer in the system clipboard. You can switch to another application and paste the value. https://mathclips.ca/calculator.html?mode=basic is the direct link to the Basic Calculator. |
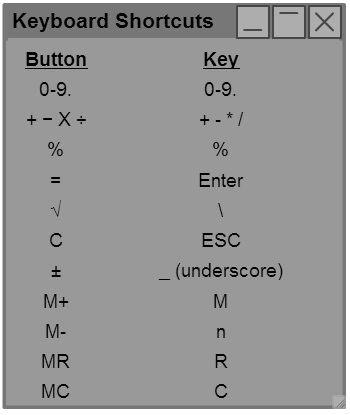 |
Keyboard ShortcutsYou can use the buttons or the keyboard shortcuts to perform calculations. If the Keyboard Shortcuts dialog is not displayed, go to the i button and select Keyboard Shortcuts. |
 |
..... |
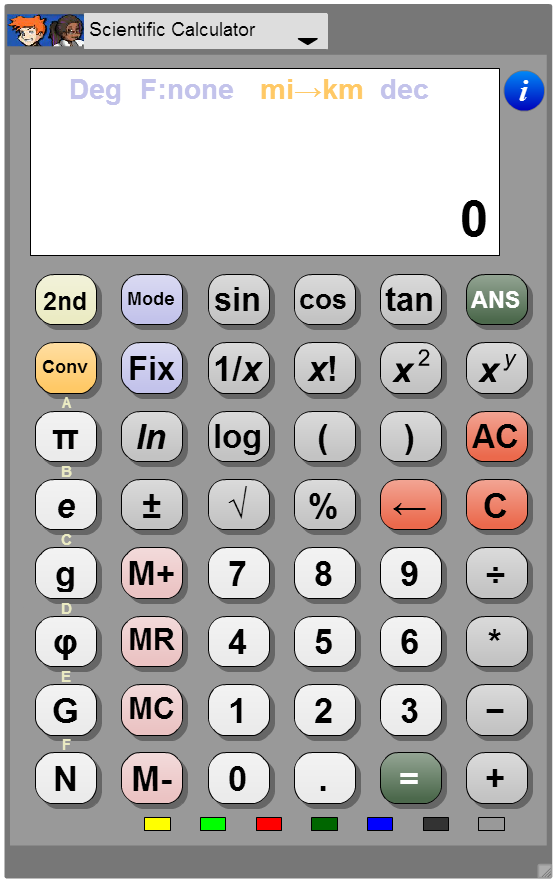
The scientific calculator has additional mathematical operators. Special keys include: 2nd: This performs the inverse operation and is used to calculate arcsin, cube roots, and powers. ANS: This returns the answer of the previous calculation. The mathematical constants buttons along the left side allow the direct input of pi, e, and several lesser known values. Press the = key to calculate the answer. This also places the answer in the system clipboard. You can switch to another application and paste the value. https://mathclips.ca/calculator.html?mode=scientific is the direct link to the Scientific Calculator. |
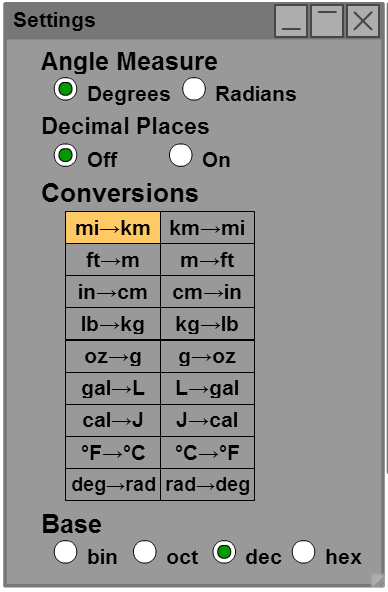 |
SettingsAccess the Settings Dialog from the i button, Mode button or Fix button. The current settings are displayed at the top of the calculator window in a gorgeous lavender colour. Switch between degree and radian mode. Set a fixed number of decimal places. Operate in base 2, 8, 10 or 16. For example, change the base to hex (16). Enter 5+5 and get the answer A. To see what that is in binary, use the settings to change the base to bin (2). It is 1010. Change the base back to dec (10) to see the answer you might have been expecting. |
|
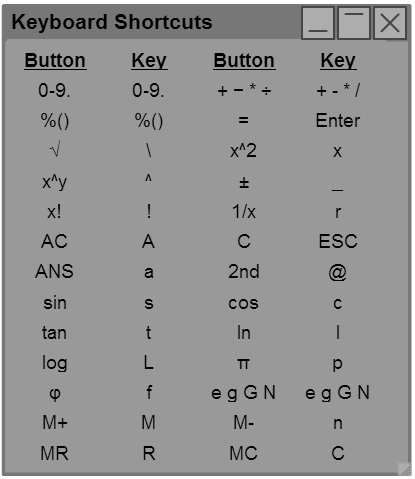 |
Keyboard ShortcutsThe list of shortcuts is accessed from the i button. There is a much more extensive list than for the basic calculator due to all the additional operators. |
|
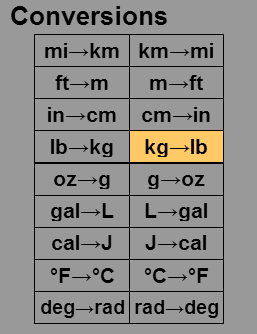 |
ConversionsTo perform a conversion, first access the settings dialog (see above). Next, click the conversion type. Kilograms to pounds has been selected in the image at left. The current conversion type is displayed at the top of the calculator window in orange. Next, on the calculator, type a value and press the Conv key. The display will show the units to avoid confusion. For example, 25 kg is about 55.1155655 lb. |
 |
..... |
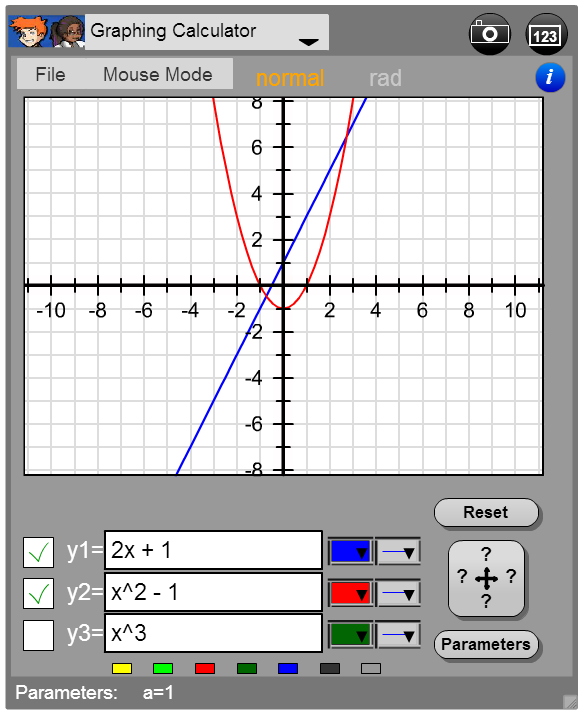
The graphing calculator allows up to 3 functions to be plotted. When the calculator opens, y1 and y2 are plotted. To plot y3, check the box to its left. Click in the text box to change the equation. The text box will be yellow and the function not displayed if the equation is not a correct form. The most common mistake is to leave out the multiplication sign. For example, xsin(x) is not valid x*sin(x) is valid. https://mathclips.ca/calculator.html?mode=graphing is the direct link to the Graphing Calculator. |
 |
Use the colour picker and the line style picker to the right of an equation to change its appearance. The graph can be solid or dashed, which is particularly useful if two functions are superimposed. |
|
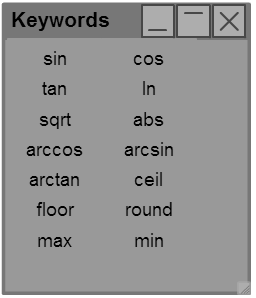 |
KeywordsAccess the Keywords Dialog from the i button. These are the functions that can be used in equations. Sample functions: sin(x) 0.5ceil(2x) max(0.5, sin(x)) Notice that the parser can handle 2x, but not xceil(x). |
|
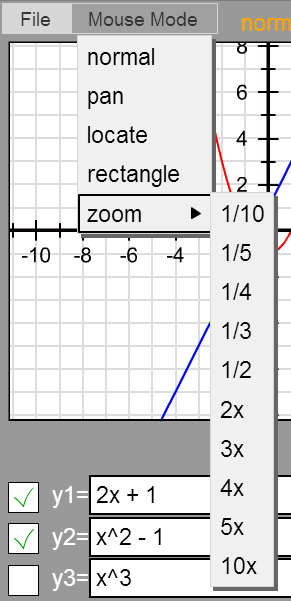 |
Mouse ModesVarious modes are available from the menu at the top left: Normal: This mode stops all interactions with the grid indicated below. Clicking on the grid allows you to reposition the calculator (and any open dialogs) in the browser window. Pan: Click and drag on the graph to adjust its location in the window. Locate: Click to add a point and display its coordinates. Click again or drag to move the point. Rectangle: Draw a rectangle and the graph will change its window to match. Watch for a Zoom Out button to help you undo the change. Zoom: Choose a zoom factor. Click on the graph and it will zoom (2x will zoom in, 1/2 will zoom out). The mouse mode is displayed in orange at the top of the calculator window. |
|
 |
Angle MeasureClick rad or deg at the top of the window to change the mode back and forth. |
|
| Space |
||
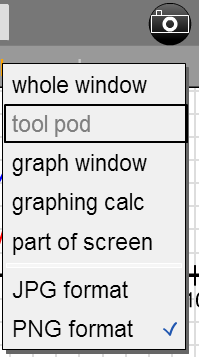 |
Capturing ImagesUse the Camera icon to take a screen shot of your work. Choose a region or "part of screen" to select your own region. Once the image is ready, you can save it as a JPG or PNG depending on the setting at the bottom of the menu or view the image in your browser. 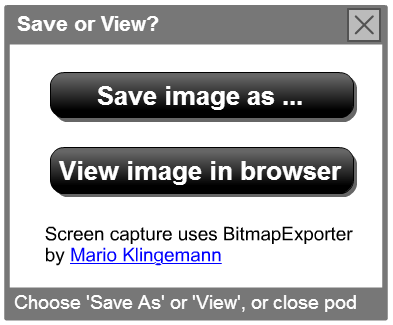 |
|
 |
Window SettingsDirectly enter values in order to change what part of the graph is displayed. Click the Window Settings icon to display the dialog or choose Window from the i button's menu. |
|
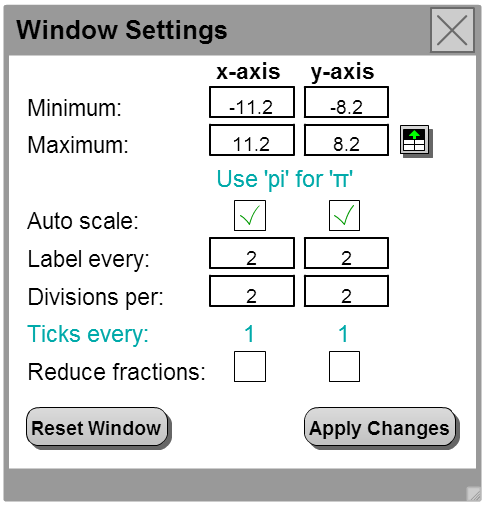 |
Typing values in the fields has no affect on the graph unless you click Apply Changes. To make a window in which the x and y scale use the same unit length, click the button to the right of the y-axis Maximum field. If you turn Auto scale off, you can force scale labels and ticks to be displayed in a custom fashion. |
|
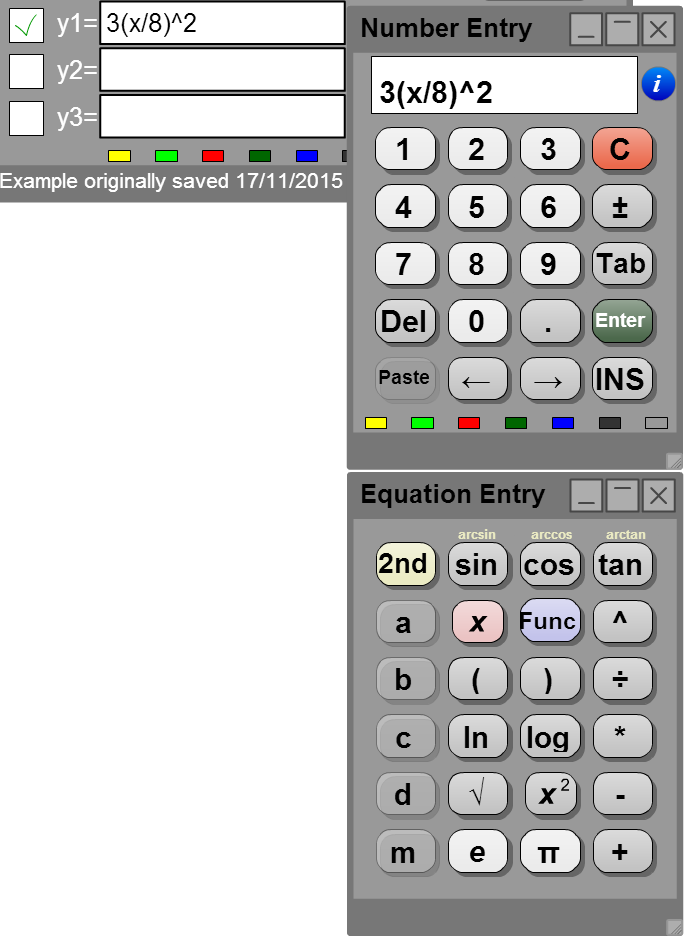 |
Number Entry and Equation Entry DialogsThe Number Entry Dialog is particularly useful if you are using an interactive white board or are using Puffin Academy on a mobile device to display the calculator and do not have ready access to a keyboard. The Number Entry Dialog is like a virtual keyboard for the calculator. To display the Number Entry Dialog, click the 123 icon. The Equation Entry Dialog allows you to enter functions and parameters in an equation entry box. It works in conjunction with the Number Entry Dialog. To display the Equation Entry Dialog, make sure the Number Entry Dialog is displayed (use the 123 icon if it is not) and then click in one of the three equation entry boxes. The parameter buttons (left hand column) are only active(white) if they are selected in the parameters list. The text on these buttons will update to reflect changes to the names of these parameters.(See below) |
|
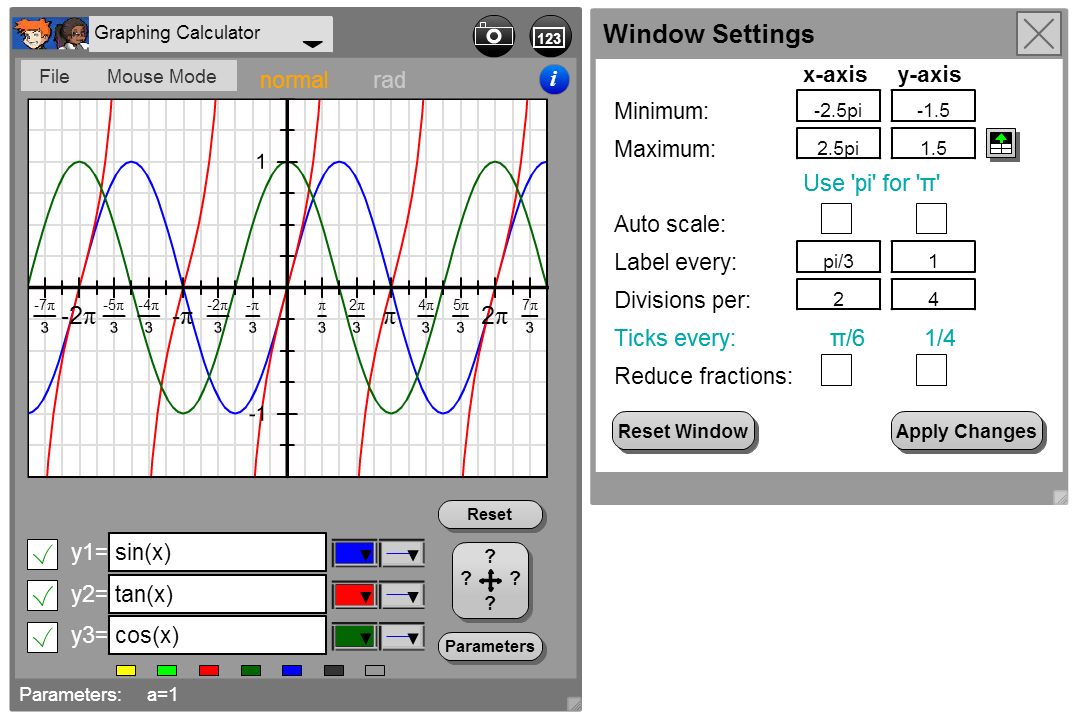 |
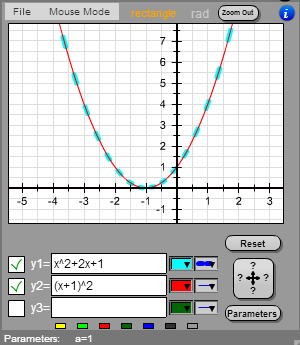
Graphing Trigonometric FunctionsIf you are using radian measure, you might find it handy to express the horizontal scale in terms of pi. In the example at right, a scale of pi/3 is being used. |
|
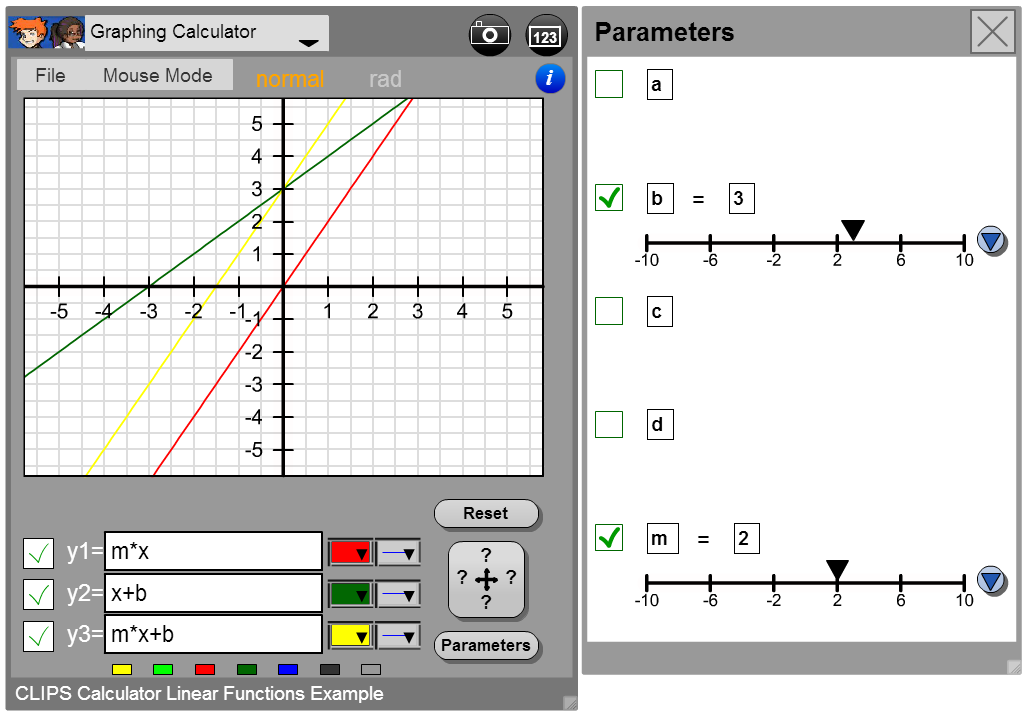 |
Loading ExamplesGo to the File menu and select Load Example. If you click on Linear Functions and close the pod, you should see three lines as well as two active parameters, b and m. If the parameters pod is not displayed, click on the Parameters button. Notice how the first equation must be written m*x since mx might be the name of another parameter. |
|
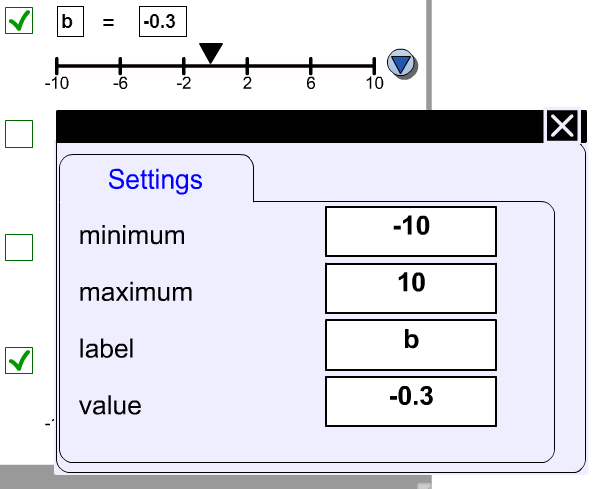 |
ParametersDrag the black triangle on the number line next to a parameter to change its value. You can also type to the right of the equals sign. Typing to the left of the equals sign changes the name of the parameter. Only parameters with a green check mark are active. To change the values displayed on the number line, click the blue triangle to the right and edit the values in the Settings dialog that appears. All of the dialogs can be dragged by their title bar. If these settings are too low in the window, they can be dragged to a more convenient spot. |
|
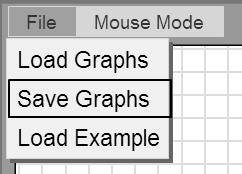 |
Saving and LoadingFrom the file menu, choose Save Graphs. Make sure that the file is saved as a .xml file. Use Load Graphs, to locate and open a previously saved .xml file. |